Pandas: Exercises
Hint
You can hone your skill with the (simple) exercises at:
Given the iris dataset:
How many rows does it contain? How many columns?
Compute the average petal length
Compute the average of all numerical columns
Extract the petal length outliers (i.e. those rows whose petal length is 50% longer than the average petal length)
Compute the standard deviation of all columns, for each iris species
Extract the petal length outliers (as above) for each iris species
Extract the group-wise petal length outliers, i.e. find the outliers (as above) for each iris species using
groupby(),aggregate(), andmerge().Hint
You can pass
as_index=Falsetogroupby()to keep theoncolumn as an actual column (rather than turn it into the index of the aggregated dataframe). Example:grouped = iris.groupby("Name", as_index=False)
Note
All the necessary files for the following exercises are here:
You will also need to count_values() method of the class Sequence:
>>> df = pd.DataFrame({
...     "col1": ["a", "a", "d", "c"],
...     "col2": ["x", "w", "d", "w"]
... })
...
>>> df
col1 col2
0    a    x
1    a    w
2    d    d
3    c    w
>>> df.col1.value_counts()
a    2
c    1
d    1
Name: col1, dtype: int64
>>> df.col2.value_counts()
w    2
d    1
x    1
Name: col2, dtype: int64
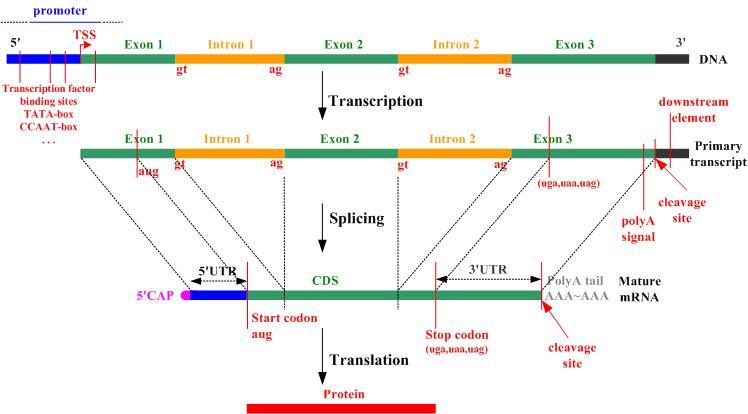
Note
Please refer to the following figure to refresh the biological concepts necessary to understand the following exercises.
The file
gene_table.txtcontains summary annotation on all human genes, based on the Ensembl annotation:For each gene, this file contains:
gene_name based on the HGNC nomenclature:
gene_biotype for example protein_coding, pseudogene, lincRNA, miRNA etc. See here for a more detailed description of the biotypes:
http://vega.sanger.ac.uk/info/about/gene_and_transcript_types.html
chromosome on which the gene is located
strand on which the gene is located
transcript_count the number of known isoforms of the gene
The incipit of the file
gene_name,gene_biotype,chromosome,strand,transcript_count
TSPAN6,protein_coding,chrX,-,5
TNMD,protein_coding,chrX,+,2
DPM1,protein_coding,chr20,-,6
SCYL3,protein_coding,chr1,-,5
C1orf112,protein_coding,chr1,+,9
...
Based on this file, write a program that:
- computes the number of genes annotated for the human genome
- computes the minimum, maximum, average and median number of known isoforms per gene (consider the transcript_count column as a series).
- plots a histogram of the number of known isoforms per gene
- computes the number of different biotypes
- computes, for each gene_biotype, the number of associated genes (a histogram), and prints the gene_biotype with the number of associated genes in decreasing order
- computes the number of different chromosomes
- computes, for each chromosome, the number of genes it contains (again, a histogram), and prints the chromosome with the corresponding number of genes in increasing order.
- computes, for each chromosome, the percentage of genes located on the
+strand - computes, for each biotype, the average number of transcripts associated to genes belonging to the biotype
The file
transcript_table.txtcontains summary annotation on all human transcripts, based on Ensembl annotation:For each transcript, this file contains:
transcript_name, composed of the gene name plus a numeric identifier
transcript_biotype for example protein_coding, retained_intron, nonsense_mediated_decay, etc., see here for a more detailed description of biotypes:
transcript_length the length of the transcript (without considering introns an poly A tail)
utr5_length the length of the 5’ UTR region (without considering introns)
cds_length the length of the CDS region (without considering introns)
utr3_length the length of the 3’ UTR region (without considering introns)
exon_count the number of exons of the transcript
canonical_flag a boolean indicating if the isoform is canonical (i.e. the reference isoform of the gene) or not. Each gene has only one canonical isoform.
The incipit of the file
transcript_name,transcript_biotype,transcript_length,utr5_length,cds_length,utr3_length,exon_count,canonical_flag
ARF5-001,protein_coding,1103,154,543,406,6,T
M6PR-001,protein_coding,2756,469,834,1453,7,T
ESRRA-002,protein_coding,2215,171,1272,772,7,F
FKBP4-001,protein_coding,3732,187,1380,2165,10,T
CYP26B1-001,protein_coding,4732,204,1539,2989,6,T
...
Based on this file, write a program that:
- computes the number of transcripts annotated for the human genome
- computes the minimum, maximum, average and median length of human transcripts
- computes the minimum, maximum, average and median length of the CDS of human transcripts (excluding values equal to 0)
- computes the percentage of human transcripts with a CDS length that is a multiple of 3 (excluding values equal to 0)
- computes the minimum, maximum, average and median length of the UTRs of human transcripts (excluding values equal to 0)
- computes, for each transcript_biotype, the number of associated transcripts (a histogram), and prints the transcript_biotype with the number of associated transcripts in decreasing order
- computes, for each transcript_biotype, the average transcript length, and prints the results in increasing order
- computes, for protein_coding transcripts, the average length of the 5’UTR, CDS and 3’ UTR
- computes, for each transcript_biotype and considering only canonical transcripts, the average number of exons
The file
exon_table.txtcontains summary annotation on human exons associated with canonical transcripts, based on the Ensembl annotation:For each exon, this file contains:
- transcript_name, the name of the transcript
- exon_id, the id of the exon
- exon_rank, the rank of the exon inside the transcript (
1for the first exon,2for the second exon, etc.) - exon_chrom_start, the genomic coordinate corresponding to the start of the exon
- exon_chrom_end, the genomic coordinate corresponding to the end of the exon
The incipit of the file
transcript_name,exon_id,exon_rank,exon_chrom_start,exon_chrom_end
ARF5-001,ENSE00001872691,1,127588345,127588565
ARF5-001,ENSE00003494180,2,127589083,127589163
ARF5-001,ENSE00003504066,3,127589485,127589594
ARF5-001,ENSE00003678978,4,127590066,127590137
ARF5-001,ENSE00003676786,5,127590963,127591088
...
Based on this file, write a program that:
- computes the minimum, maximum, average and median length of human exons
- given the name of a transcript, returns an ordered list of its exons, plus the corresponding length
Load the gene-expression timeseries from:
Then:
- How many genes are there? How many time steps?
- Are there any measurements not assigned to a gene? If there are, fill in the missing gene names by using the genes appearing above the missing entries. (Take a look at the missing data handling section above.)
- Plot the expression of gene
"ZFX"using a line plot. - Plot the mean and variance of the expression of all genes using a line plot.
- Find out which genes are more expressed at time 0, 30m, 3h, 6h, and 12h.
- Find out, for each gene, which other gene is the other most correlated.
- Draw the matrix of pairwise gene correlations using
plt.imshow().
Write a Python function that mimics the semantics of
merge(): it takes two dataframes, matches the row labels, and concatenates the matching rows.The result should be a list of lists (or, optionally, a
DataFrame).It should follow
merge()‘show="inner"semantics, i.e. drop all rows that can not be matched.Hint
Use the
iterrows()method to iterate over the rows of aDataFrame.Example:
for row in df.iterrows():
    # do something with the row (it is a series!)
Same as above, but for the
how="outer"semantics.